Advanced Options Trading Indicator: Buy & Sell Signal Generator This powerful custom indicator combines the Relative Strength Index (RSI) and Moving Average (MA) to help traders identify optimal entry and exit points in the options market. The indicator generates real-time buy and sell signals based on RSI crossovers and price positioning relative to the moving average, providing actionable insights for traders seeking to make informed decisions. Additionally, it calculates potential call and put option strike prices with a buffer for added flexibility and precision, ensuring a well-rounded approach to options trading.
Search in scripts for "Relative Strength Index (RSI)"

Big Candle Identifier with RSI Divergence and Advanced Stops1. Strategy Objective
The main goal of this strategy is to:
Identify significant price momentum (big candles).
Enter trades at opportune moments based on market signals (candlestick patterns and RSI divergence).
Limit initial risk through a fixed stop loss.
Maximize profits by using a trailing stop that activates only after the trade moves a specified distance in the profitable direction.
2. Components of the Strategy
A. Big Candle Identification
The strategy identifies big candles as indicators of strong momentum.
A big candle is defined as:
The body (absolute difference between close and open) of the current candle (body0) is larger than the bodies of the last five candles.
The candle is:
Bullish Big Candle: If close > open.
Bearish Big Candle: If open > close.
Purpose: Big candles signal potential continuation or reversal of trends, serving as the primary entry trigger.
B. RSI Divergence
Relative Strength Index (RSI): A momentum oscillator used to detect overbought/oversold conditions and divergence.
Fast RSI: A 5-period RSI, which is more sensitive to short-term price movements.
Slow RSI: A 14-period RSI, which smoothens fluctuations over a longer timeframe.
Divergence: The difference between the fast and slow RSIs.
Positive divergence (divergence > 0): Bullish momentum.
Negative divergence (divergence < 0): Bearish momentum.
Visualization: The divergence is plotted on the chart, helping traders confirm momentum shifts.
C. Stop Loss
Initial Stop Loss:
When entering a trade, an immediate stop loss of 200 points is applied.
This stop loss ensures the maximum risk is capped at a predefined level.
Implementation:
Long Trades: Stop loss is set below the entry price at low - 200 points.
Short Trades: Stop loss is set above the entry price at high + 200 points.
Purpose:
Prevents significant losses if the price moves against the trade immediately after entry.
D. Trailing Stop
The trailing stop is a dynamic risk management tool that adjusts with price movements to lock in profits. Here’s how it works:
Activation Condition:
The trailing stop only starts trailing when the trade moves 200 ticks (profit) in the right direction:
Long Position: close - entry_price >= 200 ticks.
Short Position: entry_price - close >= 200 ticks.
Trailing Logic:
Once activated, the trailing stop:
For Long Positions: Trails behind the price by 150 ticks (trail_stop = close - 150 ticks).
For Short Positions: Trails above the price by 150 ticks (trail_stop = close + 150 ticks).
Exit Condition:
The trade exits automatically if the price touches the trailing stop level.
Purpose:
Ensures profits are locked in as the trade progresses while still allowing room for price fluctuations.
E. Trade Entry Logic
Long Entry:
Triggered when a bullish big candle is identified.
Stop loss is set at low - 200 points.
Short Entry:
Triggered when a bearish big candle is identified.
Stop loss is set at high + 200 points.
F. Trade Exit Logic
Trailing Stop: Automatically exits the trade if the price touches the trailing stop level.
Fixed Stop Loss: Exits the trade if the price hits the predefined stop loss level.
G. 21 EMA
The strategy includes a 21-period Exponential Moving Average (EMA), which acts as a trend filter.
EMA helps visualize the overall market direction:
Price above EMA: Indicates an uptrend.
Price below EMA: Indicates a downtrend.
H. Visualization
Big Candle Identification:
The open and close prices of big candles are plotted for easy reference.
Trailing Stop:
Plotted on the chart to visualize its progression during the trade.
Green Line: Indicates the trailing stop for long positions.
Red Line: Indicates the trailing stop for short positions.
RSI Divergence:
Positive divergence is shown in green.
Negative divergence is shown in red.
3. Key Parameters
trail_start_ticks: The number of ticks required before the trailing stop activates (default: 200 ticks).
trail_distance_ticks: The distance between the trailing stop and price once the trailing stop starts (default: 150 ticks).
initial_stop_loss_points: The fixed stop loss in points applied at entry (default: 200 points).
tick_size: Automatically calculates the minimum tick size for the trading instrument.
4. Workflow of the Strategy
Step 1: Entry Signal
The strategy identifies a big candle (bullish or bearish).
If conditions are met, a trade is entered with a fixed stop loss.
Step 2: Initial Risk Management
The trade starts with an initial stop loss of 200 points.
Step 3: Trailing Stop Activation
If the trade moves 200 ticks in the profitable direction:
The trailing stop is activated and follows the price at a distance of 150 ticks.
Step 4: Exit the Trade
The trade is exited if:
The price hits the trailing stop.
The price hits the initial stop loss.
5. Advantages of the Strategy
Risk Management:
The fixed stop loss ensures that losses are capped.
The trailing stop locks in profits after the trade becomes profitable.
Momentum-Based Entries:
The strategy uses big candles as entry triggers, which often indicate strong price momentum.
Divergence Confirmation:
RSI divergence helps validate momentum and avoid false signals.
Dynamic Profit Protection:
The trailing stop adjusts dynamically, allowing the trade to capture larger moves while protecting gains.
6. Ideal Market Conditions
This strategy performs best in:
Trending Markets:
Big candles and momentum signals are more effective in capturing directional moves.
High Volatility:
Larger price swings improve the probability of reaching the trailing stop activation level (200 ticks).

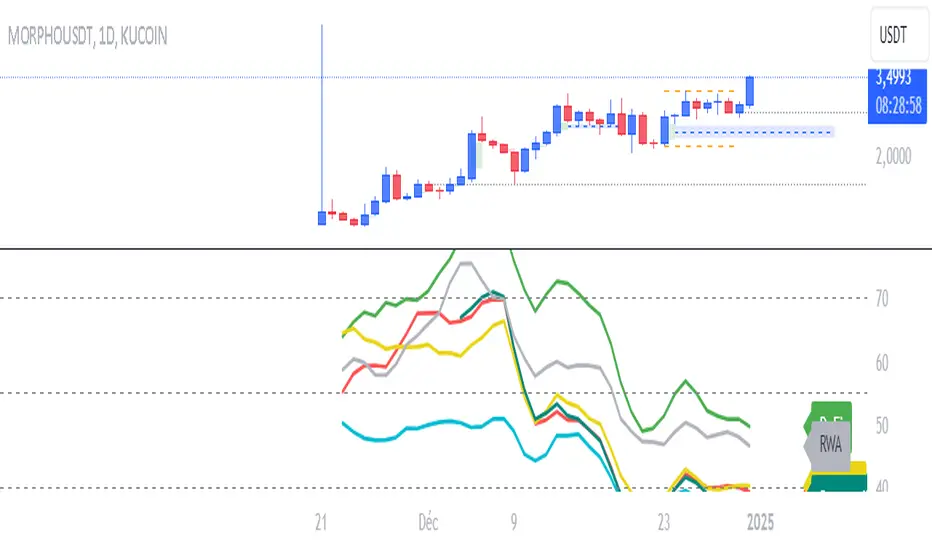
RSI NarrativesDescription:
The RSI Narratives script aggregates Relative Strength Index (RSI) values across multiple cryptocurrency narratives or sectors, providing an easy-to-read visual and alert system for trend reversals and overbought/oversold conditions. This tool is designed for traders looking to track sector-specific trends and compare performance across AI, DeFi, Level 1 blockchains, and more.
Key Features:
RSI Aggregation by Sector: Calculates average RSI for key narratives, including AI, DeFi, Level 1 blockchains, new memes, and more.
Customizable RSI Settings: Adjust RSI period, line width, and label offsets for personalized analysis.
Dynamic Alerts: Receive alerts when a narrative enters overbought or oversold territory, helping you act quickly on market movements.
Clean Visualization: Overlay sector-specific SMA lines with distinct colors and optional labels for quick interpretation.
Multi-Narrative Comparison: Analyze trends across diverse narratives to identify emerging opportunities.
Parameters for Customization:
RSI Period: Set the lookback period for RSI calculations (default: 14).
Line Width: Adjust the thickness of plotted lines (default: 2).
Label Offset: Control label placement for better chart readability.
Overbought/Oversold Thresholds: Configure the RSI levels for alerts (default: 70/40).
How to Use:
Add the script to your TradingView chart.
Customize the RSI parameters to suit your trading strategy.
Monitor the plotted SMA lines to identify narrative-specific trends.
Set alerts for overbought and oversold conditions to stay informed in real time.
Alerts System:
Alerts trigger when a narrative crosses predefined overbought or oversold levels.
Text notifications suggest potential trading actions, such as selling on overbought or buying on oversold.
Intended Users:
This script is ideal for crypto traders, sector analysts, and market enthusiasts who want to track performance across narratives and gain actionable insights into sector rotations.
Disclaimer:
This script is for educational and informational purposes only. It does not constitute financial advice. Please test on historical data and practice caution when trading.
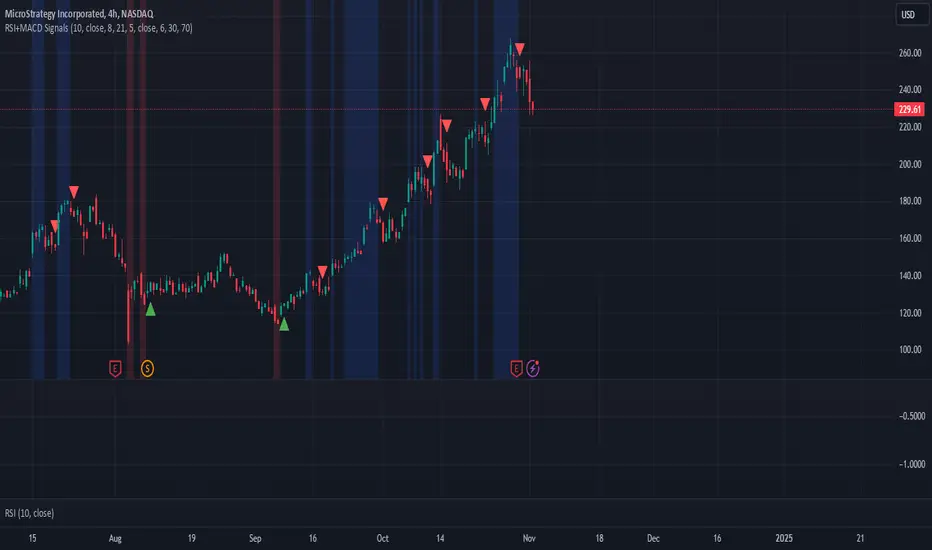
DAILY Supertrend + EMA Crossover with RSI FilterThis strategy is a technical trading approach that combines multiple indicators—Supertrend, Exponential Moving Averages (EMAs), and the Relative Strength Index (RSI)—to identify and manage trades.
Core Components:
1. Exponential Moving Averages (EMAs):
Two EMAs, one with a shorter period (fast) and one with a longer period (slow), are calculated. The idea is to spot when the faster EMA crosses above or below the slower EMA. A fast EMA crossing above the slow EMA often suggests upward momentum, while crossing below suggests downward momentum.
2. Supertrend Indicator:
The Supertrend uses Average True Range (ATR) to establish dynamic support and resistance lines. These lines shift above or below price depending on the prevailing trend. When price is above the Supertrend line, the trend is considered bullish; when below, it’s considered bearish. This helps ensure that the strategy trades only in the direction of the overall trend rather than against it.
3. RSI Filter:
The RSI measures momentum. It helps avoid buying into markets that are already overbought or selling into markets that are oversold. For example, when going long (buying), the strategy only proceeds if the RSI is not too high, and when going short (selling), it only proceeds if the RSI is not too low. This filter is meant to improve the quality of the trades by reducing the chance of entering right before a reversal.
4. Time Filters:
The strategy only triggers entries during user-specified date and time ranges. This is useful if one wants to limit trading activity to certain trading sessions or periods with higher market liquidity.
5. Risk Management via ATR-based Stops and Targets:
Both stop loss and take profit levels are set as multiples of the ATR. ATR measures volatility, so when volatility is higher, both stops and profit targets adjust to give the trade more breathing room. Conversely, when volatility is low, stops and targets tighten. This dynamic approach helps maintain consistent risk management regardless of market conditions.
Overall Logic Flow:
- First, the market conditions are analyzed through EMAs, Supertrend, and RSI.
- When a buy (long) condition is met—meaning the fast EMA crosses above the slow EMA, the trend is bullish according to Supertrend, and RSI is below the specified “overbought” threshold—the strategy initiates or adds to a long position.
- Similarly, when a sell (short) condition is met—meaning the fast EMA crosses below the slow EMA, the trend is bearish, and RSI is above the specified “oversold” threshold—it initiates or adds to a short position.
- Each position is protected by an automatically calculated stop loss and a take profit level based on ATR multiples.
Intended Result:
By blending trend detection, momentum filtering, and volatility-adjusted risk management, the strategy aims to capture moves in the primary trend direction while avoiding entries at excessively stretched prices. Allowing multiple entries can potentially amplify gains in strong trends but also increases exposure, which traders should consider in their risk management approach.
In essence, this strategy tries to ride established trends as indicated by the Supertrend and EMAs, filter out poor-quality entries using RSI, and dynamically manage trade risk through ATR-based stops and targets.

RSI Strategy With TP/SL - Lower TFThis Pine Script strategy integrates the Relative Strength Index (RSI) for trade signals with user-defined Take Profit (TP) and Stop Loss (SL) levels. It's designed for flexible application in different market conditions, offering long, short, or dual-direction trading.
Short Description
The strategy uses the RSI to identify overbought and oversold market conditions:
Buy signal: When RSI drops below the specified "Buy Level."
Sell signal: When RSI rises above the "Sell Level."
Additionally, it manages risk and profit targets with:
Take Profit (TP): Exits trades when the price reaches a percentage gain.
Stop Loss (SL): Exits trades to limit losses if the price falls by a certain percentage.
The strategy is versatile and includes options for visualizing performance, monthly profit/loss data, and detailed trade metrics.
How to Use
Set Parameters:
RSI Period: Default is 14. Adjust based on your analysis.
RSI Buy/Sell Levels:
Buy Level: Default is 40. Consider higher levels for conservative entries.
Sell Level: Default is 60. Lower this for earlier exits.
Take Profit (%): Set your profit target (default: 5%).
Stop Loss (%): Set your risk tolerance (default: 2%).
Trade Direction: Choose "Long Only," "Short Only," or "Both."
Interpret Signals:
Buy signals appear when RSI crosses below the buy threshold.
Sell signals appear when RSI crosses above the sell threshold.
Risk Management:
The strategy dynamically calculates TP and SL levels for each trade.
TP/SL is applied using the percentage input based on the entry price.
Monitor Performance:
Review trade statistics in the "Strategy Tester."
Use the monthly performance table to track P/L across months.
Customize Alerts:
Alerts for buy, sell, TP, and SL events can be used to automate notifications.
Key Features
Configurable RSI Settings: Adaptable to various market conditions.
Risk Management: Built-in TP and SL management.
Customizable Trade Direction: Tailored for long-only, short-only, or both directions.
Monthly P/L Table: Visualizes performance trends over time.
Alerts: Notifies when critical trade events occur.
Please do your own research before ase this to your real trading.

Ido strategy RSI Oversold with MACD Buy Signal Indicator
This indicator combines the Relative Strength Index (RSI) and the Moving Average Convergence Divergence (MACD) to help identify potential buy signals based on oversold conditions and trend reversals. This script is designed for traders looking to identify entry points when an asset is likely undervalued (oversold) and showing bullish momentum.
How It Works
RSI Oversold Detection: The RSI measures the speed and change of price movements. This indicator flags when the RSI falls below 30, signaling that the asset may be oversold. The user can customize the RSI lookback period and the timeframe within which oversold conditions are considered relevant.
MACD Crossover: The MACD line crossing above the Signal line often indicates a shift to bullish momentum. In this script, a buy signal is generated when a MACD bullish crossover occurs after an RSI oversold condition has been met within a user-defined lookback window.
Buy Signal: A green triangle appears below the price chart each time both conditions are met—when the RSI has recently been in oversold territory and the MACD line crosses above the Signal line. This signal suggests that the asset may be positioned for a potential upward trend, providing a visual cue for entry points.
Customizable Settings
RSI Settings: Adjust the RSI source and period length.
MACD Settings: Customize the fast, slow, and signal lengths of the MACD to suit different market conditions.
Lookback Period: Define how many bars back to check for an RSI oversold condition before confirming a MACD crossover.
Visual Elements
Oversold Background Color: The background on the price chart is shaded red whenever the RSI is below 30.
Buy Signal: A green triangle is displayed on the chart to indicate a potential entry point when both conditions are met.
Alerts
This indicator includes optional alerts, allowing traders to receive notifications whenever the conditions for a buy signal are met, making it easier to monitor multiple assets and stay informed of trading opportunities.
This indicator is ideal for traders using a combination of momentum and trend reversal strategies, especially in volatile markets where oversold conditions often precede a trend change.
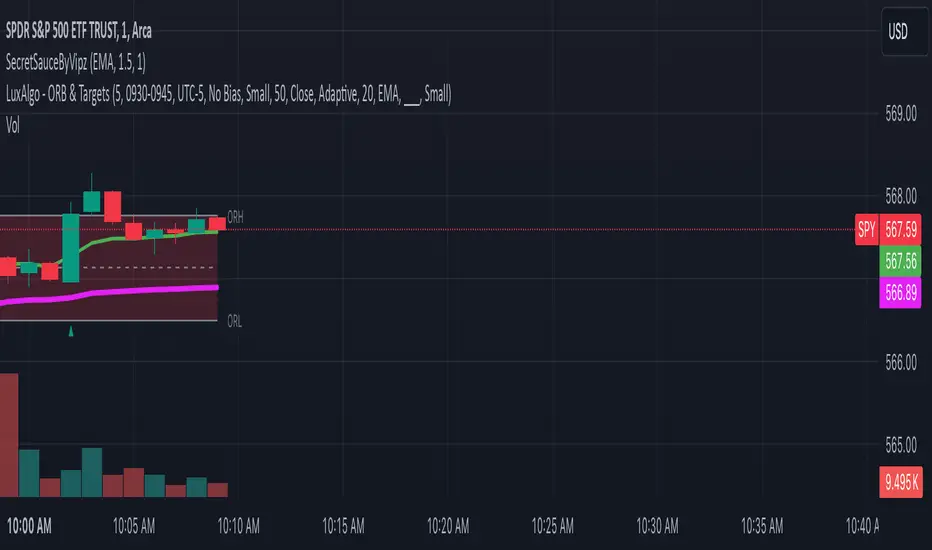
SecretSauceByVipzOverview:
SecretSauceByVipz is a sophisticated trading indicator designed to help traders identify high-probability buy and sell signals by integrating multiple technical analysis tools. By combining Exponential Moving Averages (EMAs), Average True Range (ATR) buffer zones, Volume Weighted Average Price (VWAP), and Relative Strength Index (RSI) momentum confirmation, this indicator aims to reduce false signals and enhance trading decisions.
Key Features:
Exponential Moving Averages (EMAs):
200-period EMA (Long EMA): Serves as a long-term trend indicator.
8-period EMA (Fast EMA): Captures short-term price movements.
21-period EMA (Slow EMA): Reflects medium-term price trends.
EMA Crossovers: Generates initial buy/sell signals when the fast EMA crosses over or under the slow EMA.
ATR-Based Buffer Zones:
ATR Calculation: Utilizes a 14-period ATR to measure market volatility.
Buffer Zone Multiplier: User-adjustable multiplier (default 1.0) applied to the ATR to create dynamic buffer zones around the 200 EMA.
Buffer Zones: Helps filter out false signals by requiring price to move beyond these zones for certain signals.
Volume Weighted Average Price (VWAP):
VWAP Plotting: Provides an average price weighted by volume, useful for identifying fair value areas and potential support/resistance levels.
Signal Confirmation Logic:
Confirmation Candle: Requires the next candle after a crossover to close in the signal's direction for added reliability.
Early Signals: Triggers when price crosses the 200 EMA and moves beyond the buffer zone, indicating potential early trend changes.
Strong Signals: Occur when both the price crosses the fast EMA and the fast EMA crosses the slow EMA simultaneously.
RSI Momentum Confirmation:
RSI Calculation: Uses a 14-period RSI to gauge market momentum.
Momentum Filter: Confirms signals only when RSI aligns with the trend (above 50 for bullish, below 50 for bearish signals).
Visual Aids:
EMA and VWAP Plots: Overlays the EMAs and VWAP directly on the price chart for easy visualization.
Buffer Zone Lines: Plots the upper and lower buffer zones around the 200 EMA.
Signal Labels:
Buy Signals: Displayed as green "BUY" labels below the bars.
Sell Signals: Displayed as red "SELL" labels above the bars.
How to Use:
Trend Identification:
Use the 200 EMA to determine the overall market trend.
Price above the 200 EMA suggests a bullish trend; below indicates a bearish trend.
Signal Generation:
Confirmed Signals: Wait for the confirmation candle after an EMA crossover before considering entry.
Early Signals: Consider early entries when price crosses the 200 EMA and moves beyond the buffer zone.
Strong Signals: Pay attention to strong signals where both price and EMAs are crossing over, indicating robust trend momentum.
Momentum Confirmation:
Ensure the RSI aligns with the signal direction:
Buy Signals: RSI should be above 50.
Sell Signals: RSI should be below 50.
Adjusting Sensitivity:
Modify the ATR Multiplier and Buffer Multiplier to suit different market conditions and personal trading styles.
A higher multiplier may reduce signal frequency but increase reliability.
Customization Parameters:
ATR Multiplier for Distance Filter (Default: 1.5):
Adjusts the sensitivity of the distance filter based on ATR.
Buffer Multiplier for 200 EMA (Default: 1.0):
Alters the width of the buffer zones around the 200 EMA.
Benefits:
Reduces False Signals: The combination of confirmation candles and buffer zones helps filter out noise.
Enhances Trend Detection: Multiple EMA crossovers provide insights into short-term and medium-term trends.
Incorporates Volatility and Momentum: ATR and RSI ensure signals consider market volatility and momentum.
Disclaimer:
This indicator is a tool to assist in technical analysis and should not be used as the sole basis for trading decisions. Always conduct thorough analysis and consider risk management strategies before executing trades. Past performance is not indicative of future results.
Credits:
Developed by Vipink1203.
Version:
Pine Script Version 5
Power Root SuperTrend [AlgoAlpha]📈🚀 Power Root SuperTrend by AlgoAlpha - Elevate Your Trading Strategy! 🌟
Introducing the Power Root SuperTrend by AlgoAlpha, an advanced trading indicator that enhances the traditional SuperTrend by incorporating Root-Mean-Square (RMS) calculations for a more responsive and adaptive trend detection. This innovative tool is designed to help traders identify trend directions, potential take-profit levels, and optimize entry and exit points with greater accuracy, making it an excellent addition to your trading arsenal.
Key Features:
🔹 Root-Mean-Square SuperTrend Calculation : Utilizes the RMS of closing prices to create a smoother and more sensitive SuperTrend line that adapts quickly to market changes.
🔸 Multiple Take-Profit Levels : Automatically calculates and plots up to seven take-profit levels (TP1 to TP7) based on market volatility and the change in SuperTrend values.
🟢 Dynamic Trend Coloring : Visually distinguish between bullish and bearish trends with customizable colors for clearer market visualization.
📊 RSI-Based Take-Profit Signals : Incorporates the Relative Strength Index (RSI) of the distance between the price and the SuperTrend line to generate additional take-profit signals.
🔔 Customizable Alerts : Set alerts for trend direction changes, achievement of take-profit levels, and RSI-based take-profit conditions to stay informed without constant chart monitoring.
How to Use:
Add the Indicator : Add the indicator to favorites by pressing the ⭐ icon or search for "Power Root SuperTrend " in the TradingView indicators library and add it to your chart. Adjust parameters such as the ATR multiplier, ATR length, RMS length, and RSI take-profit length to suit your trading style and the specific asset you are analyzing.
Analyze the Chart : Observe the SuperTrend line and the plotted take-profit levels. The color changes indicate trend directions—green for bullish and red for bearish trends.
Set Alerts : Utilize the built-in alert conditions to receive notifications when the trend direction changes, when each TP level is drawn, or when RSI-based take-profit conditions are met.
How It Works:
The Power Root SuperTrend indicator enhances traditional SuperTrend calculations by applying a Root-Mean-Square (RMS) function to the closing prices, resulting in a more responsive trend line that better reflects recent price movements. It calculates the Average True Range (ATR) to determine the volatility and sets the upper and lower SuperTrend bands accordingly. When a trend direction change is detected—signified by the SuperTrend line switching from above to below the price or vice versa—the indicator calculates the change in the SuperTrend value. This change is then used to establish multiple take-profit levels (TP1 to TP7), each representing incremental targets based on market volatility. Additionally, the indicator computes the RSI of the distance between the current price and the SuperTrend line to generate extra take-profit signals when the RSI crosses under a specific threshold. The combination of RMS calculations, multiple TP levels, dynamic coloring, and RSI signals provides traders with a comprehensive tool for identifying trends and optimizing trade exits. Customizable alerts ensure that traders can stay updated on important market developments without needing to constantly watch the charts.
Elevate your trading strategy with the Power Root SuperTrend indicator and gain a smarter edge in the markets! 🚀✨

Weekly RSI Buy/Sell SignalsWeekly RSI Buy/Sell Signal Indicator
This indicator is designed to help traders identify high-probability buy and sell opportunities on the weekly chart by using the Relative Strength Index (RSI). By utilizing weekly RSI values, this indicator ensures signals align with broader market trends, providing a clearer view of potential price reversals and continuation.
How It Works:
Weekly RSI Calculation: This script calculates the RSI using a 14-period setting, focusing on the weekly timeframe regardless of the user’s current chart view. The weekly RSI is derived using request.security, allowing for consistent signals even on intraday charts.
Signal Conditions:
Buy Signal: A buy signal appears when the RSI crosses above the oversold threshold of 30, suggesting that price may be gaining momentum after a potential bottom.
Sell Signal: A sell signal triggers when the RSI crosses below the overbought threshold of 70, indicating a possible momentum shift downwards.
Visual Cues:
Buy/Sell Markers: Clear green "BUY" and red "SELL" markers are displayed on the chart when buy or sell conditions are met, making it easy to identify entry and exit points.
RSI Line and Thresholds: The weekly RSI value is plotted in real time with color-coded horizontal lines at 30 (oversold) and 70 (overbought), providing a visual reference for key levels.
This indicator is ideal for traders looking for reliable, trend-based signals on higher timeframes and can be a helpful tool for filtering out shorter-term market noise.

Harmony Signal Flow By ArunThis Pine Script strategy, titled "Harmony Signal Flow By Arun," uses the Relative Strength Index (RSI) indicator to generate buy and sell signals based on custom thresholds. The script incorporates stop-loss and target management and restricts new trades until the previous position closes. Here's a detailed description:
Custom RSI Metric:
The strategy calculates a 5-period RSI based on the closing price, aiming for a more responsive measure of price momentum.
RSI thresholds are defined:
Lower threshold (30): Indicates oversold conditions, triggering a potential buy.
Upper threshold (70): Indicates overbought conditions, prompting a possible sell.
Entry Conditions:
Buy Signal: The strategy initiates a buy order when the RSI crosses above the lower threshold (30), indicating a shift from oversold conditions.
Sell Signal: A sell order is triggered when the RSI crosses below the upper threshold (70), suggesting an overbought reversal.
Only one order (buy or sell) can be active at a time, ensuring that a new trade begins only when there’s no existing position.
Stop-Loss and Target Management:
For each trade, stop-loss and target conditions are applied to manage risk and secure profits.
For Buy Positions:
Stop-loss is set 100 points below the entry price.
Target is set 150 points above the entry price.
For Sell Positions:
Stop-loss is set 100 points above the entry price.
Target is 150 points below the entry price.
The strategy closes the trade when either the stop-loss or target is met, marking the trade as "closed" and allowing a new trade entry.
Trade Sequencing:
A new trade (buy or sell) is only permitted after the previous position hits either its stop-loss or target, preventing overlapping trades and ensuring clear trade sequences.
This sequential approach enhances risk management by ensuring only one active position at any time.
End-of-Day Closure:
All open positions are closed automatically at 3:25 PM (Indian market time) to avoid overnight exposure, ensuring the strategy remains strictly intraday.
The flag for trade entry is reset at the end of each day, enabling fresh trades the next day.
Chart Indicators:
The script plots buy and sell signals directly on the chart with visible labels.
It also displays the custom RSI metric with horizontal lines for the lower and upper thresholds, providing visual cues for entry and exit points.
Summary
This strategy is a momentum-based intraday trading approach that uses the RSI for identifying potential reversals and manages trades through predefined stop-loss and target levels. By enforcing trade sequencing and closing positions at the end of the trading day, it prioritizes risk management and seeks to capitalize on short-term trends while avoiding overnight market risks.

RSI Ignoring Gaps Between DaysThe RSI Ignoring Gaps Between Days indicator is an advanced modification of the traditional Relative Strength Index (RSI) designed to exclude price gaps that occur between the last bar of one trading day and the first bar of the next. This ensures that the RSI calculations remain focused on the actual price action during the trading session, avoiding distortions caused by overnight price gaps.
Key Features:
Gap Ignoring Mechanism: The indicator detects when a new day begins and skips the price change between the last bar of the previous day and the first bar of the current day. This ensures that only the intra-day price changes are included in the RSI calculation.
Intra-day Price Movement: The RSI calculations are based on real price changes within each trading day, providing a clearer reflection of momentum without interference from overnight events.
Dynamic RSI Calculation: The traditional RSI formula is preserved, but gains and losses are recalculated based on price changes from bar to bar within the same day.
Overbought/Oversold Levels: The indicator retains standard RSI overbought (70) and oversold (30) levels, allowing traders to easily identify potential reversal zones.
Alerts for Crossovers: Built-in alert conditions trigger when the RSI crosses key levels (30 or 70), signaling potential buying or selling opportunities.
This indicator is particularly useful for traders looking to focus on intra-day price action and avoid the influence of gaps caused by overnight market activity. It is suitable for intraday trading strategies where consistency in price movement measurement is crucial.
Buy/Sell IndicatorBuy/Sell Indicator
Overview
The Buy/Sell Indicator is designed to help traders identify potential entry and exit points in the market using a combination of Simple Moving Averages (SMA) and the Relative Strength Index (RSI). This indicator plots buy and sell signals directly on the chart, making it easier to make informed trading decisions.
Inputs
Fast MA Length: The period for the fast-moving average. Default is 9.
Slow MA Length: The period for the slow-moving average. Default is 21.
RSI Length: The period for the RSI calculation. Default is 14.
RSI Overbought Level: The RSI level considered overbought. Default is 70.
RSI Oversold Level: The RSI level considered oversold. Default is 30.
How It Works
Moving Averages:
The indicator calculates two SMAs: a fast-moving average (fastMA) and a slow-moving average (slowMA).
The fast MA reacts more quickly to price changes, while the slow MA reacts more slowly.
RSI:
The RSI is calculated to measure the momentum of price movements.
It helps identify overbought and oversold conditions in the market.
Buy and Sell Conditions:
Buy Signal: A buy signal is generated when the fast MA crosses above the slow MA and the RSI is below the overbought level.
Sell Signal: A sell signal is generated when the fast MA crosses below the slow MA and the RSI is above the oversold level.
Plotting
Buy Signals: Displayed as green labels below the bars where the buy condition is met.
Sell Signals: Displayed as red labels above the bars where the sell condition is met.
Moving Averages: The fast MA is plotted in blue, and the slow MA is plotted in orange.

Enhanced Overbought/Oversold IndicatorEnhanced Overbought/Oversold Indicator
Description:
The Enhanced Overbought/Oversold Indicator is a custom technical analysis tool designed to identify potential reversal points in the market by highlighting conditions of overbought and oversold levels on any timeframe. This indicator is based on the Relative Strength Index (RSI), a momentum oscillator that measures the speed and change of price movements.
Features:
Overbought & Oversold Levels:
Overbought (RSI > 70): Indicates that the market is potentially overvalued and might be due for a pullback. The candles are highlighted in Red to signal caution.
Oversold (RSI < 30): Indicates that the market is potentially undervalued and might be due for a bounce. The candles are highlighted in Green to signal potential buying opportunities.
Extreme Conditions:
Extreme Overbought (RSI > 85): Indicates an extremely overbought condition, suggesting a very high likelihood of a reversal or correction. The candles are highlighted in Blue.
Extreme Oversold (RSI < 15): Indicates an extremely oversold condition, suggesting a strong potential for a reversal upwards. The candles are highlighted in Yellow.
Dynamic Highlighting:
The indicator dynamically adjusts the candle colors based on the current RSI value, providing a clear visual representation of market conditions.
Applications:
Trend Reversals: By identifying extreme RSI levels, the indicator helps traders anticipate possible trend reversals.
Entry & Exit Points: Traders can use the highlighted signals to make more informed decisions about entering or exiting trades.
Risk Management: The color-coded signals can be used to manage risk, especially during extreme market conditions.
This indicator is particularly useful for traders looking for a straightforward visual representation of market conditions across different timeframes. By combining standard and extreme RSI levels, it helps identify not just overbought and oversold conditions but also extreme levels where significant reversals are more likely.

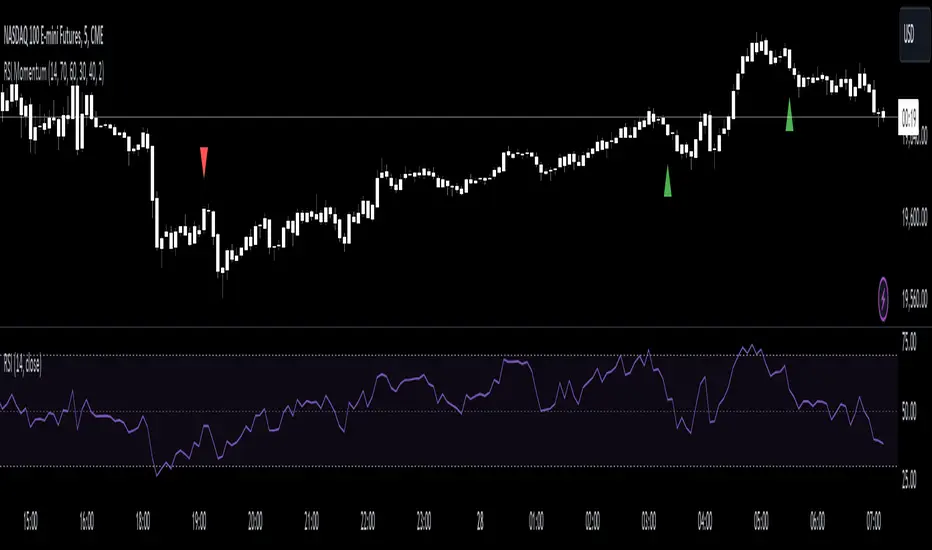
RSI Momentum [CrossTrade]The RSI Momentum indicator generates buy and sell signals based on the Relative Strength Index (RSI) crossing specific thresholds. The Key difference is that we're using RSI overbought and oversold readings as the foundation for finding continuation signals in the same direction of that momentum. This solves the issue of trying to buy the bottom or sell the top and offsets any oscillators main weakness, divergence and false signals in a strong trend.
Key Parameters:
RSI Length: Determines the calculation period for the RSI.
Overbought Threshold: The RSI level above which the asset is considered overbought.
Momentum Loss Threshold for Buy: The RSI level below which a loss in upward momentum is indicated, triggering a potential buy signal.
Oversold Threshold: The RSI level below which the asset is considered oversold.
Momentum Loss Threshold for Sell: The RSI level above which a loss in downward momentum is indicated, triggering a potential sell signal.
Allow Additional Retracement Signals: A toggle to allow more than one signal within a certain number of bars after the first signal.
Max Additional Signals: The maximum number of additional signals allowed after the first signal.
Buy Signal Logic:
Initial Signal: Generated when the RSI first exceeds the overbought threshold and then falls below the momentum loss buy threshold. Defaults are 70 for the overbought threshold and 60 for the retracement level.
Additional Signals for Deeper Retracements: If enabled, the script shows additional buy signals within the maximum limit set by Max Additional Signals. These additional signals are shown only if each new signal's bar has a lower low than the previous signal's bar.
Sell Signal Logic:
Initial Signal: Similar to the buy signal, a sell signal is generated when the RSI first drops below the oversold threshold and then rises above the momentum loss sell threshold. Defaults are 30 for the oversold threshold and 40 for the retracement level.
Additional Signals for Deeper Retracements: If enabled, additional sell signals are shown, limited by Max Additional Signals, and only if each new signal's bar has a higher high than the previous signal's bar.
Continuation Signals in Strong Trends:
The script allows for a new series of signals (starting with the first signal again) when the RSI pattern repeats. For buy signals, this means going above the overbought and then below the momentum loss buy threshold. For sell signals, it's dropping below oversold and then above the momentum loss sell threshold.
Alerts:
The script includes alert conditions for both buy and sell signals, which can be configured in the TradingView alerts.
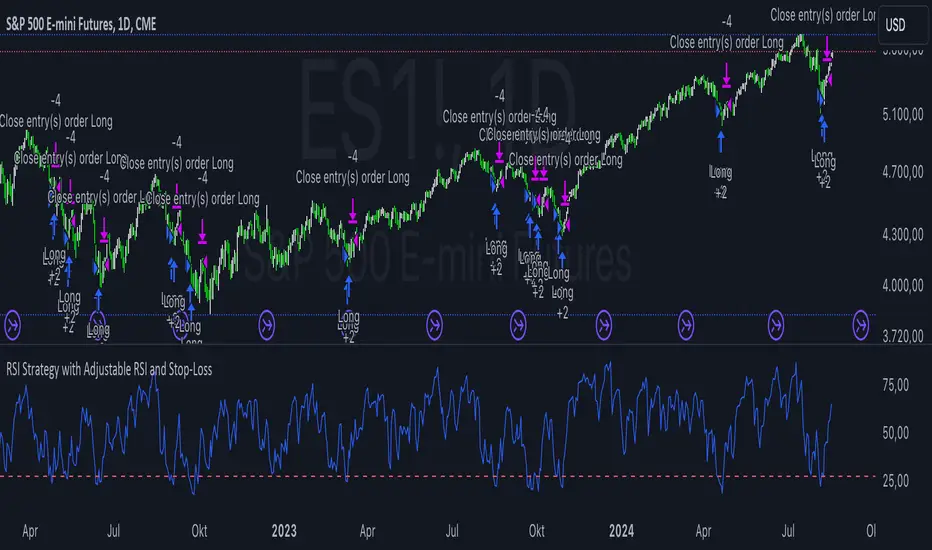
RSI Strategy with Adjustable RSI and Stop-LossThis trading strategy uses the Relative Strength Index (RSI) and a Stop-Loss mechanism to make trading decisions. Here’s a breakdown of how it works:
RSI Calculation:
The RSI is calculated based on the user-defined length (rsi_length). This is a momentum oscillator that measures the speed and change of price movements.
Buy Condition:
The strategy generates a buy signal when the RSI value is below a user-defined threshold (rsi_threshold). This condition indicates that the asset might be oversold and potentially due for a rebound.
Stop-Loss Mechanism:
Upon triggering a buy signal, the strategy calculates the Stop-Loss level. The Stop-Loss level is set to a percentage below the entry price, as specified by the user (stop_loss_percent). This level is used to limit potential losses if the price moves against the trade.
Sell Condition:
A sell signal is generated when the current closing price is higher than the highest high of the previous day. This condition suggests that the price has reached a new high, and the strategy decides to exit the trade.
Plotting:
The RSI values are plotted on the chart for visual reference. A horizontal line is drawn at the RSI threshold level to help visualize the oversold condition.
Summary
Buying Strategy: When RSI is below the specified threshold, indicating potential oversold conditions.
Stop-Loss: Set based on a percentage of the entry price to limit potential losses.
Selling Strategy: When the price surpasses the highest high of the previous day, signaling a potential exit point.
This strategy aims to capture potential rebounds from oversold conditions and manage risk using a Stop-Loss mechanism. As with any trading strategy, it’s essential to test and optimize it under various market conditions to ensure its effectiveness.
Supply and Demand Zones with Enhanced SignalsThis Pine Script indicator combines supply and demand zone analysis with dynamic buy/sell signals to enhance trading strategies. It provides a robust framework for identifying optimal trading opportunities and managing existing trades.
Key Features:
Supply and Demand Zones: The indicator identifies significant supply and demand zones based on recent price action. These zones are plotted as horizontal lines to help traders visualize potential reversal points.
Exponential Moving Average (EMA): A 21-period EMA is used to determine the prevailing trend and generate buy and sell signals.
Relative Strength Index (RSI): The 14-period RSI is utilized to filter buy and sell signals, providing additional context on overbought and oversold conditions.
Signal Generation:
Buy Signal: Triggered when the price crosses above the EMA and RSI indicates that the market is not overbought.
Sell Signal: Triggered when the price crosses below the EMA and RSI indicates that the market is not oversold.
Enhanced Exit Signals:
Exit Buy Signal: Generated if an opposite sell signal occurs or the higher timeframe RSI indicates overbought conditions.
Exit Sell Signal: Generated if an opposite buy signal occurs or the higher timeframe RSI indicates oversold conditions.
Trade Management:
Tracks active trades and provides exit signals based on the occurrence of opposite trading signals. This helps in managing positions more effectively and reducing potential losses.
Usage:
Supply and Demand Zones: Look for price action around these zones to identify potential trading opportunities.
EMA and RSI: Use buy and sell signals in conjunction with EMA and RSI to validate trading decisions.
Higher Timeframe RSI: Utilize this for additional confirmation and exit signals.
Plotting:
Supply Zone: Plotted as a red horizontal line.
Demand Zone: Plotted as a green horizontal line.
EMA: Plotted as a blue line.
Buy and Sell Signals: Indicated by green and red triangle shapes, respectively.
Exit Signals: Indicated by blue and orange X shapes.
This indicator is designed to help traders make informed decisions by combining technical analysis with strategic trade management.

HMA Crossover 1H with RSI, Stochastic RSI, and Trailing StopThe strategy script provided is a trading algorithm designed to help traders make informed buy and sell decisions based on certain technical indicators. Here’s a breakdown of what each part of the script does and how the strategy works:
Key Components:
Hull Moving Averages (HMA):
HMA 5: This is a Hull Moving Average calculated over 5 periods. HMAs are used to smooth out price data and identify trends more quickly than traditional moving averages.
HMA 20: This is another HMA but calculated over 20 periods, providing a broader view of the trend.
Relative Strength Index (RSI):
RSI 14: This is a momentum oscillator that measures the speed and change of price movements over a 14-period timeframe. It helps identify overbought or oversold conditions in the market.
Stochastic RSI:
%K: This is the main line of the Stochastic RSI, which combines the RSI and the Stochastic Oscillator to provide a more sensitive measure of overbought and oversold conditions. It is smoothed with a 3-period simple moving average.
Trading Signals:
Buy Signal:
Generated when the 5-period HMA crosses above the 20-period HMA, indicating a potential upward trend.
Additionally, the RSI must be below 45, suggesting that the market is not overbought.
The Stochastic RSI %K must also be below 39, confirming the oversold condition.
Sell Signal:
Generated when the 5-period HMA crosses below the 20-period HMA, indicating a potential downward trend.
The RSI must be above 60, suggesting that the market is not oversold.
The Stochastic RSI %K must also be above 63, confirming the overbought condition.
Trailing Stop Loss:
This feature helps protect profits by automatically selling the position if the price moves against the trade by 5%.
For sell positions, an additional trailing stop of 100 points is included.

Multi Timeframe RSI Buy Sell Strategy [TradeDots]The "Multi Timeframe RSI Buy/Sell Strategy" is a trading strategy that utilizes Relative Strength Index (RSI) indicators from multiple timeframes to provide buy and sell signals.
This strategy allows for extensive customization, supporting up to three distinct RSIs, each configurable with its own timeframe, length, and data source.
HOW DOES IT WORK
This strategy integrates up to three RSIs, each selectable from different timeframes and customizable in terms of length and source. Users have the flexibility to define the number of active RSIs. These selections visualize as plotted lines on the chart, enhancing interpretability.
Users can also manage the moving average of the selected RSI lines. When multiple RSIs are active, the moving average is calculated based on these active lines' average value.
The color intensity of the moving average line changes as it approaches predefined buying or selling thresholds, alerting users to potential signal generation.
A buy or sell signal is generated when all active RSI lines simultaneously cross their respective threshold lines. Concurrently, a label will appear on the chart to signify the order placement.
For those preferring not to display order information or activate the strategy, an "Enable backtest" option is provided in the settings for toggling activation.
APPLICATION
The strategy leverages multiple RSIs to detect extreme market conditions across various timeframes without the need for manual timeframe switching.
This feature is invaluable for identifying divergences across timeframes, such as detecting potential short-term reversals within broader trends, thereby aiding traders in making better trading decisions and potentially avoiding losses.
DEFAULT SETUP
Commission: 0.01%
Initial Capital: $10,000
Equity per Trade: 60%
RISK DISCLAIMER
Trading entails substantial risk, and most day traders incur losses. All content, tools, scripts, articles, and education provided by TradeDots serve purely informational and educational purposes. Past performances are not definitive predictors of future results.
TradeDots Stochastic Z-Score

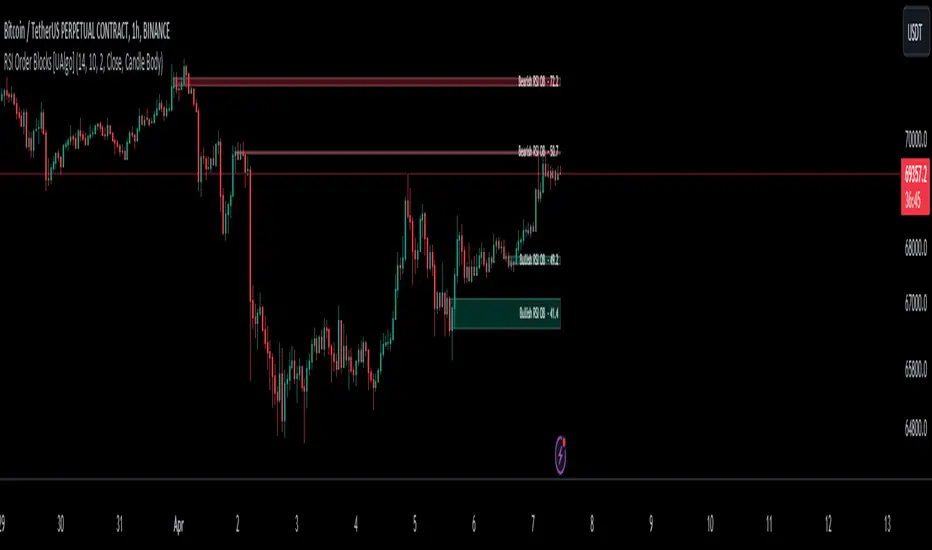
RSI Order Blocks [UAlgo]The "RSI Order Blocks " identifies and visualizes potential order blocks based on the Relative Strength Index (RSI) indicator. These zones may indicating potential support or resistance levels.
🔶 Key Features :
RSI-based Order Block Identification: The script utilizes the RSI indicator to identify potential order blocks. It detects pivot highs and lows in the RSI, which are indicative of potential reversal points, and marks these areas as potential order blocks.
Order Block Visualization: Identified order blocks are visually represented on the chart, making it easy for traders to recognize and interpret these significant price zones. Both bullish and bearish order blocks are differentiated by color, enhancing clarity and ease of analysis. Additionally, within each order block, the RSI value of that block is also shown.
RSI Overbought/Oversold Filter: Optionally, users can apply a filter based on RSI levels to refine the detection of order blocks. This filter prevents the creation of order blocks when the RSI is within specified overbought or oversold conditions (default between 30 and 70), helping traders focus on areas of potentially significant price action.
An Example with the OB/OS Filter Feature Turned Off:
An Example with the OB/OS Filter Feature Turned On:
Mitigation of Broken Order Blocks: Provides flexibility in selecting the mitigation method (based on close or wick) for determining order block breaches.
Customizable Parameters: The script offers a range of customizable parameters to tailor the detection and visualization of order blocks to suit individual trading preferences. Users can adjust parameters such as RSI Length, Order Block Detection Sensitivity, Mitigation Method, and order block style to fine-tune the analysis according to their trading strategy.
🔶 Disclaimer :
Not Financial Advice: This indicator is intended for educational and informational purposes only. It does not constitute financial advice or recommendations to buy, sell, or hold any financial instruments.
Use at Own Risk: Trading involves substantial risk of loss and is not suitable for all investors. Users of this indicator should exercise caution and conduct their own research and analysis before making any trading decisions.
Performance Not Guaranteed: Past performance is not indicative of future results. While the indicator aims to assist traders in analyzing market trends, there is no guarantee of accuracy or success in trading operations.
Fusion Traders - RSI Overbought/Oversold + Divergence IndicatorFusion Traders - RSI Overbought/Oversold + Divergence Indicator - new version
This indicator has lots of various add ons.
RSI overbought / oversold with changeable inputs
Divergence indicator
DESCRIPTION:
This script combines the Relative Strength Index ( RSI ), Moving Average and Divergence indicator to make a better decision when to enter or exit a trade.
- The Moving Average line (MA) has been made hidden by default but enhanced with an RSIMA cloud.
- When the RSI is above the selected MA it turns into green and when the RSI is below the select MA it turns into red.
- When the RSI is moving into the Overbought or Oversold area, some highlighted areas will appear.
- When some divergences or hidden divergences are detected an extra indication will be highlighted.
- When the divergence appear in the Overbought or Oversold area the more weight it give to make a decision.
- The same colour pallet has been used as the default candlestick colours so it looks familiar.
HOW TO USE:
The prerequisite is that we have some knowledge about the Elliot Wave Theory, the Fibonacci Retracement and the Fibonacci Extension tools.
We are hoping you like this indicator and added to your favourite indicators. If you have any question then comment below, and I'll do my best to help.
FEATURES:
• You can show/hide the RSI .
• You can show/hide the MA.
• You can show/hide the lRSIMA cloud.
• You can show/hide the Stoch RSI cloud.
• You can show/hide and adjust the Overbought and Oversold zones.
• You can show/hide and adjust the Overbought Extended and Oversold Extended zones.
• You can show/hide the Overbought and Oversold highlighted zones.
HOW TO GET ACCESS TO THE SCRIPT:
• Favorite the script and add it to your chart.
RSI Volatility Bands [QuantraSystems]RSI Volatility Bands
Introduction
The RSI Volatility Bands indicator introduces a unique approach to market analysis by combining the traditional Relative Strength Index (RSI) with dynamic, volatility adjusted deviation bands. It is designed to provide a highly customizable method of trend analysis, enabling investors to analyze potential entry and exit points in a new and profound way.
The deviation bands are calculated and drawn in a manner which allows investors to view them as areas of dynamic support and resistance.
Legend
Upper and Lower Bands - A dynamic plot of the volatility-adjusted range around the current price.
Signals - Generated when the RSI volatility bands indicate a trend shift.
Case Study
The chart highlights the occurrence of false signals, emphasizing the need for caution when the bands are contracted and market volatility is low.
Juxtaposing this, during volatile market phases as shown, the indicator can effectively adapt to strong trends. This keeps an investor in a position even through a minor drawdown in order to exploit the entire price movement.
Recommended Settings
The RSI Volatility Bands are highly customisable and can be adapted to many assets with diverse behaviors.
The calibrations used in the above screenshots are as follows:
Source = close
RSI Length = 8
RSI Smoothing MA = DEMA
Bandwidth Type = DEMA
Bandwidth Length = 24
Bandwidth Smooth = 25
Methodology
The indicator first calculates the RSI of the price data, and applies a custom moving average.
The deviation bands are then calculated based upon the absolute difference between the RSI and its moving average - providing a unique volatility insight.
The deviation bands are then adjusted with another smoothing function, providing clear visuals of the RSI’s trend within a volatility-adjusted context.
rsiVal = ta.rsi(close, rsiLength)
rsiEma = ma(rsiMA, rsiVal, bandLength)
bandwidth = ma(bandMA, math.abs(rsiVal - rsiEma), bandLength)
upperBand = ma(bandMA, rsiEma + bandwidth, smooth)
lowerBand = ma(bandMA, rsiEma - bandwidth, smooth)
long = upperBand > 50 and not (lowerBand < lowerBand and lowerBand < 50)
short= not (upperBand > 50 and not (lowerBand < lowerBand and lowerBand < 50))
By dynamically adjusting to market conditions, the RSI trend bands offer a unique perspective on market trends, and reversal zones.

RSI Divergence AlertsIndicator Description: RSI Divergence Alerts
The RSI Divergence indicator is a technical analysis tool that identifies divergences between the Relative Strength Index (RSI) and the price of an asset. The RSI is a momentum indicator that measures the speed and magnitude of recent changes in an asset's price, while divergences occur when there is a disparity between price movements and the RSI.
Indicator Customization:
Overbought and Oversold: The indicator allows you to customize the overbought and oversold levels of the RSI. This allows traders to adjust parameters according to their preferences and the historical behavior of the asset in question.
Indicator Settings and Recommended Adjustments:
Max Bar Distance: This parameter determines the maximum distance allowed between two low or high points for a divergence to be recognized. A higher value may result in more signals, but may also increase the number of false signals. It is recommended to adjust this value based on the volatility of the asset and the time period in which it is being traded.
RSI Length: This is the time period used to calculate the RSI. A longer period smoothes the indicator, while a shorter period makes it more sensitive to price changes. The default value is 14, but traders can adjust it based on their trading strategy and the asset's volatility.
RSI Overbought and Oversold: These values determine the levels at which the RSI is considered overbought and oversold, respectively. The default value for overbought is 75 and for oversold is 35. Traders can adjust these values according to the asset's volatility and its historical analysis. For example, in more volatile assets, it may be useful to use more extreme levels, such as 80 for overbought and 20 for oversold.
When adjusting indicator settings, traders must consider the balance between sensitivity and accuracy. Careful tuning of these parameters can help filter out false signals and identify more reliable trading opportunities.
The alerts functionality in this RSI Divergence indicator is designed to notify traders when a bearish divergence or a bullish divergence is detected. Here's how it works:
Conditionally Triggered Alerts:
Alerts are triggered based on the boolean variables bearishDivergence and bullishDivergence.
If bearishDivergence is true, it indicates that a bearish divergence has been detected.
If bullishDivergence is true, it indicates that a bullish divergence has been detected.
Alert Message:
When a divergence is detected, an alert message is generated to inform the trader about the event.
The message includes details about the divergence, such as the difference in the RSI value between the two points forming the divergence.
For example, for a bearish divergence, the message will include the phrase "Bearish RSI Divergence Detected" and the RSI difference between the high and low points of the divergence.
Alert Frequency:
Alerts are configured to be triggered once per bar close (alert.freq_once_per_bar_close), which means the alert will only be sent once at the close of each bar.
This helps to avoid multiple alerts for the same divergence during the same time period.
Additional Alert Conditions:
In addition to conditionally triggered alert messages, alert conditions are defined for both bearish and bullish divergences.
These alert conditions are useful for configuring custom alerts on trading platforms that support running Pine Script code.
Overall, this alert functionality allows traders to stay informed about potential trading opportunities based on divergences detected by the indicator. This can help traders make faster and more informed decisions in their trading processes.

RSI in Candlestick MODEDescription:
The "RSI Bar" indicator is a versatile tool designed to enhance your technical analysis on trading charts. This Pine Script™ code calculates the Relative Strength Index (RSI) for open, close, high, and low prices, and represents the results as bars on the chart. The bars are color-coded based on whether the closing RSI is higher or lower than the opening RSI.
Additionally, the indicator incorporates advanced features such as Pareto analysis and Gaussian smoothing. The Pareto analysis helps identify significant lows and highs in the RSI, providing insights into potential trend reversals. The Gaussian smoothing further refines the analysis, contributing to a more accurate representation of the average RSI trend.
Key Features:
RSI calculation for open, close, high, and low prices.
Color-coded bars for easy visualization of RSI trends.
Pareto analysis to highlight key RSI levels indicating potential reversals.
Gaussian smoothing for improved trend analysis and visualization.
Heiken-Ashi
